

Bitcoin price found support and began a recovery wave above $88,000. BTC is currently rising and could attempt to break above the $89,000 resistance.
- Bitcoin has started a wave of recovery above the $88,000 zone.
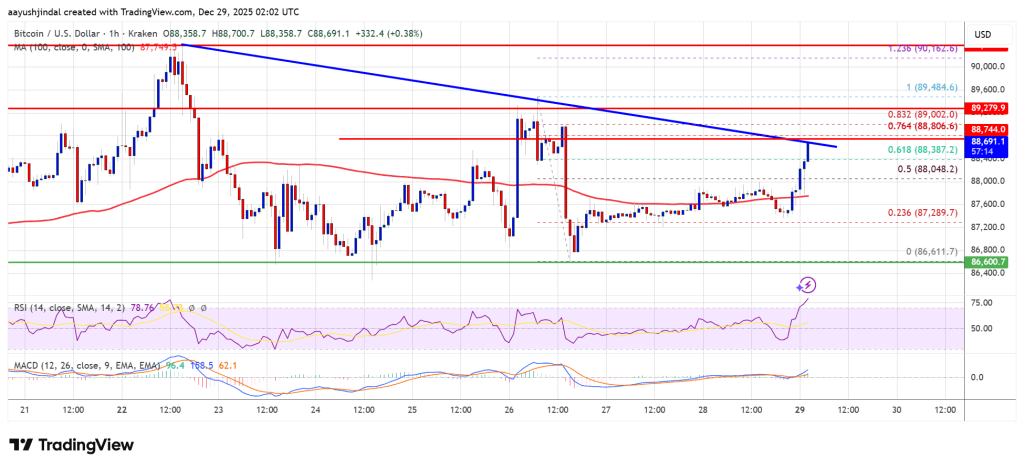
- The price is trading above $88,000 and the 100 hourly simple moving average.
- On the hourly chart of the BTC/USD pair, a bearish trend line has formed with resistance at $88,750 (data feed from Kraken).
- If it trades above the $89,500 zone, the pair is likely to continue moving higher.
Bitcoin price faces resistance
Bitcoin price managed to stay in the positive zone above $85,500 and a wave of recovery began. BTC picked up pace on the move above the $87,000 and $87,200 levels.
Price rose above the 50% Fib retracement level of the decline from the swing high of $89,484 to the low of $86,611. Bulls pushed the price above $88,000. Bitcoin is currently trading above $88,000 and its 100-hour simple moving average.
If the price remains stable above $88,000, it could attempt a new wave of recovery. Immediate resistance lies near the $88,750 level and the 76.4% Fib retracement level of the decline from the swing high of $89,484 to the low of $86,611. Additionally, a bearish trend line has formed on the hourly chart of the BTC/USD pair with resistance at $88,750.
The first major resistance level is near the $89,500 level. The next resistance level could be at $89,800. If the price closes above the $89,800 resistance, the price could move higher. In the above case, the price may rise and test the $90,200 resistance level. Further upside could push the price closer to the $90,500 level. The next hurdles for the bulls could be $91,500 and $92,000.
Will BTC fall again?
If Bitcoin fails to rise above the $89,500 resistance zone, further decline could begin. Immediate support is near the $88,000 level. The first major support is near the $87,250 level.
The next support is currently located near the $86,500 zone. Any further losses could send the price towards the $85,500 support in the near term. The main support lies at $84,500, below which BTC could accelerate its decline in the short term.
Technical indicators:
Hourly MACD – The MACD is currently pacing in the bullish zone.
Hourly RSI (Relative Strength Index) – BTC/USD’s RSI is currently above the 50 level.
Major support level – $88,000, then $87,250.
Key resistance levels – $88,750 and $89,500.

