
Solana failed to break above $146 and corrected its gains. SOL price is currently trading below $145 and could see bidding near the $140 zone.
- The SOL price started to correct below $145 against the US dollar.
- The price is currently trading below $145 and the 100 hourly simple moving average.
- On the hourly chart of the SOL/USD pair, a bullish trendline is forming with support at $141 (data source: Kraken).
- Losses may widen if the price falls below the $140 zone.
Solana price begins to correct downwards
Solana’s price was unable to exceed $150 and began a downward correction similar to Bitcoin and Ethereum. SOL fell below $146 and $145, entering the short-term bearish zone.
There was a move below the 61.8% Fib retracement level of the upwave from the swing low of $138 to the high of $149. However, the bulls are active above $140. Furthermore, on the hourly chart of the SOL/USD pair, a bullish trend line has formed with support at $141.
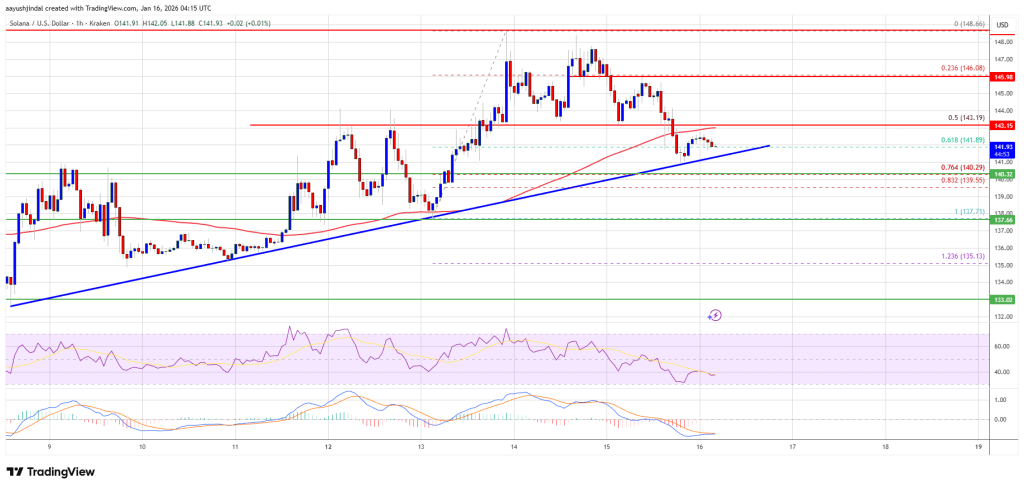
Solana is currently trading below $145 and its 100-hour simple moving average. On the upside, the price is facing resistance near the $144 level. The next major resistance level is near the $146 level. The main resistance level could be at $148. A close above the $148 resistance zone could set the pace for further steady upside. The next major resistance level is $155. Any further rise could send the price towards the $162 level.
More SOL losses?
If SOL fails to break above the $146 resistance level, further decline could begin. Initial support on the downside is near the $141 zone and trend line. The first major support is near the $140 level and the 76.4% fib retracement level of the upwave from the $138 swing low to the $149 high.
Below the $140 level, the price may head towards the $132 support zone. If there is a close below the $132 support, the price could fall towards the $124 support in the short term.
technical indicators
Hourly MACD – The MACD for SOL/USD is gaining pace in the bearish zone.
Hourly RSI (Relative Strength Index) – The RSI for SOL/USD is below the 50 level.
Major support levels – $141 and $140.
Key resistance levels – $146 and $148.

