
Bitcoin Price Analysis: What’s Behind BTC’s Drop to $82K?
Is the bull run over, or is Bitcoin just getting started again? Let’s dive into real-time market trends, technical indicators, and future price predictions.
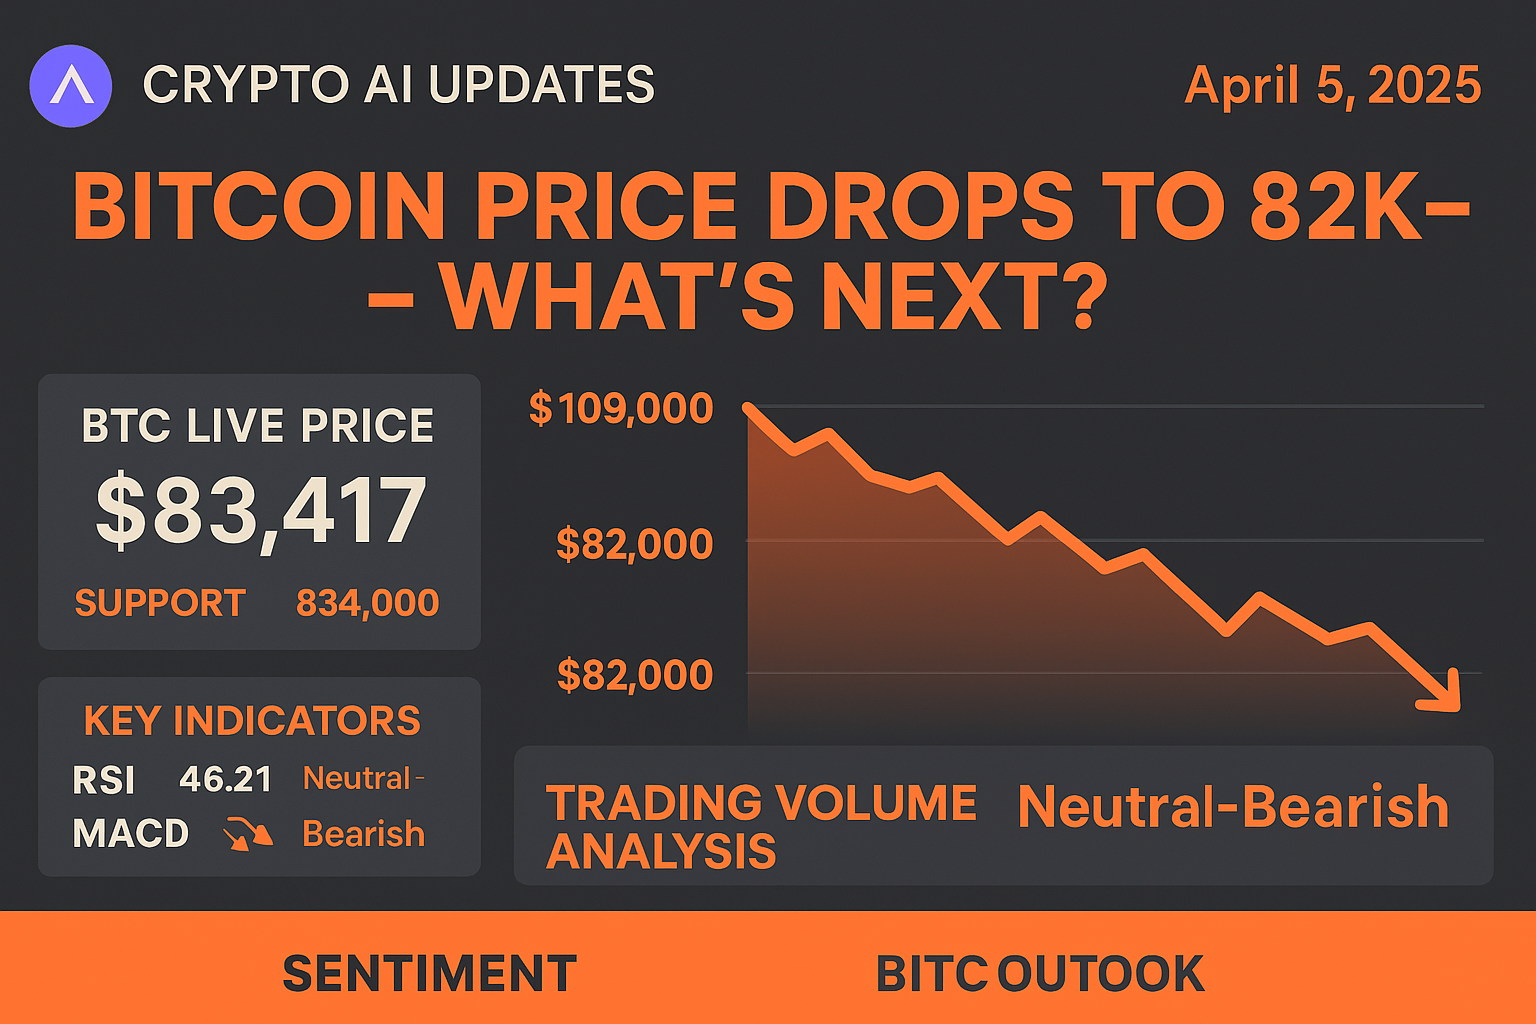
Real-Time Bitcoin Price Update – April 5, 2025
Bitcoin (BTC) has dropped from its 2024 high of $109,000 to approximately $82,000, triggering a wave of questions across the crypto trading community. The cryptocurrency is currently testing support levels after failing to break resistance near $84,750.
Live BTC Price: $83,417
24-Hour Change: -1.8%
Support Level: $82,000
Resistance Zone: $83,800–$84,000
Bitcoin Technical Analysis: RSI, MACD, and Moving Averages
- Relative Strength Index (RSI): 46.21 — a neutral-bearish zone
- MACD: Bearish momentum continues; signal lines remain below zero
- Death Cross Warning: The 50-day moving average is close to crossing below the 200-day — a historically bearish sign
- Volume: Weak buy-side pressure = slow momentum
What’s a Death Cross?
It’s a bearish chart pattern that occurs when the short-term 50-day moving average drops below the long-term 200-day MA. This is often seen as a sell signal, suggesting potential downward pressure.
Market Insight: Are We Nearing the End of Bitcoin’s Bull Cycle?
According to CryptoQuant’s Quick Take analyst Crypto Dan, Bitcoin trading volumes follow a two-stage downward trend, often signaling the final phase of a bull market.
Key Indicators:
- Two-step volume decline = early warning signs
- Monthly RSI of 60 still holding as support — a crucial threshold used during previous Bitcoin peaks in 2019 and 2020
- No strong volume = no breakout
Market sentiment remains mixed. Some expect a bounce; others brace for further declines.
BTC Market Outlook: What’s Next for Bitcoin in 2025?
After recovering slightly from the $82,000 zone, Bitcoin is still under pressure.
Bitcoin is still under pressure.
A MACD death cross, low RSI, and limited trading volume suggest a neutral-to-bearish outlook unless BTC can break and hold above $84,000 with strong volume.
If BTC fails to clear resistance, another dip to the $82,000 demand zone is likely.
Bearish Indicators:
- Fading buying power
- Weak trading volume
- No confirmation of a bullish reversal
- Delayed investor interest
Bullish Potential (Needs Confirmation):
- RSI rebound
- Higher volume breakout above $84,000
- External catalysts (ETF approvals, macroeconomic support, etc.)
TL;DR — Bitcoin Market Recap
✅ BTC peaked at $109,000 in January 2024
✅ Currently trading near $82,000
✅ Weak volume + death cross = caution
✅ RSI and MACD remain in bearish zones
✅ Resistance: $83,800–$84,000
✅ Support: $82,000
✅ Market Sentiment: Neutral to Bearish
Stay Ahead with CRYPTO AI UPDATES
We bring you real-time crypto news, Bitcoin technical analysis, AI-driven price predictions, and the latest in Web3, DeFi, and blockchain innovation.

